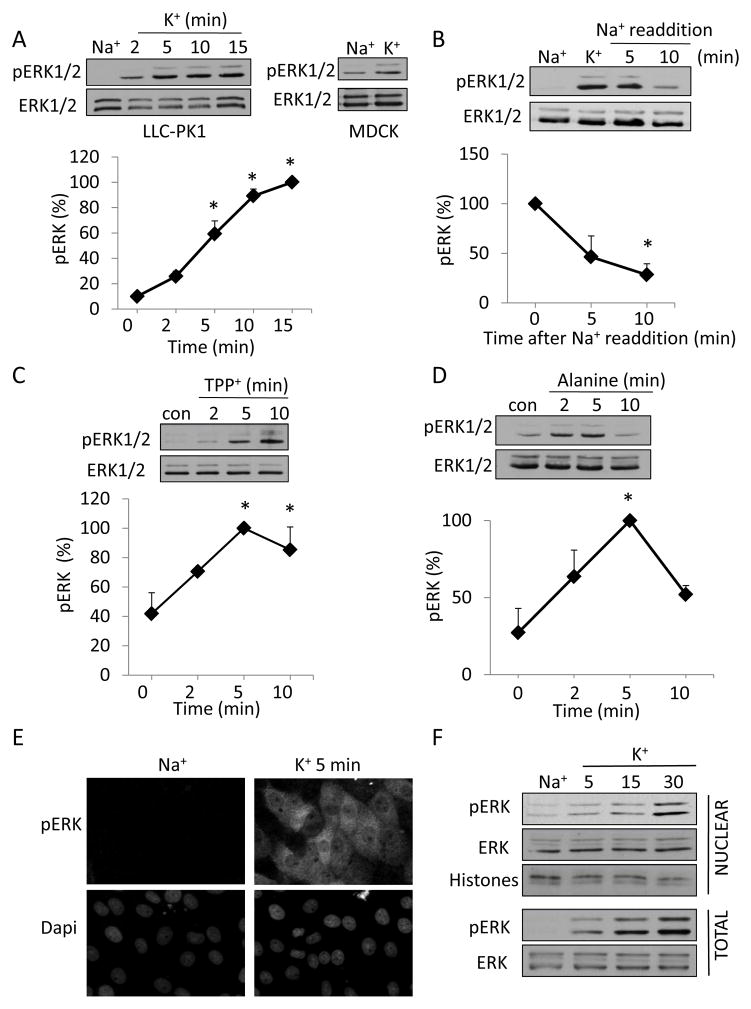
Figure 1. Plasma membrane depolarization induces ERK phosphorylation in epithelial cells.
LLC-PK1 (A–D) or MDCK (A) cells grown to confluence were serum-deprived for 3 h and preincubated in Na+-medium for 15 min. In A and B the cells were treated with Na+ or K+ -medium for the indicated times (A) or 10 minutes (B). In B, following the treatment with K+-medium, the Na+-medium was added back for the indicated times. In C and D the cells were exposed to 0.5 mM TPP+ (C) or 20 mM L-Alanine (D). At the end of the treatments, the cells were lysed and total and phosphorylated ERK was detected using Western blotting as described in Materials and Methods. The graphs represent densitometric quantification of pERK Western blots. The values are expressed as the % of the maximal effect, taken as 100%. Data are mean± S.E. (n≥3). Where error bars are not visible, they are smaller than the symbol. For all panels, * indicates significance vs. 0 min (p<0.05). E,F. Depolarization-induced ERK phosphorylation occurs both in the cytosol and the nucleus. E. Confluent LLC-PK1 layers, grown on coverslips, were incubated with Na+ or K+ -medium for 5 minutes. The cells were fixed and pERK was visualized by immunofluorescence as described in Materials and Methods. Nuclei were visualized using Dapi. F. LLC-PK1 cells were grown on 6-cm dishes. Following treatment with Na+ - or K+ -medium for the indicated times, the cells were lysed and nuclear fractions were isolated as described in Materials and Methods. The presence of pERK and total ERK in samples containing 10 μg protein was tested using Western blotting. An antibody detecting histones was used to shown equal loading in the nuclear fractions.

