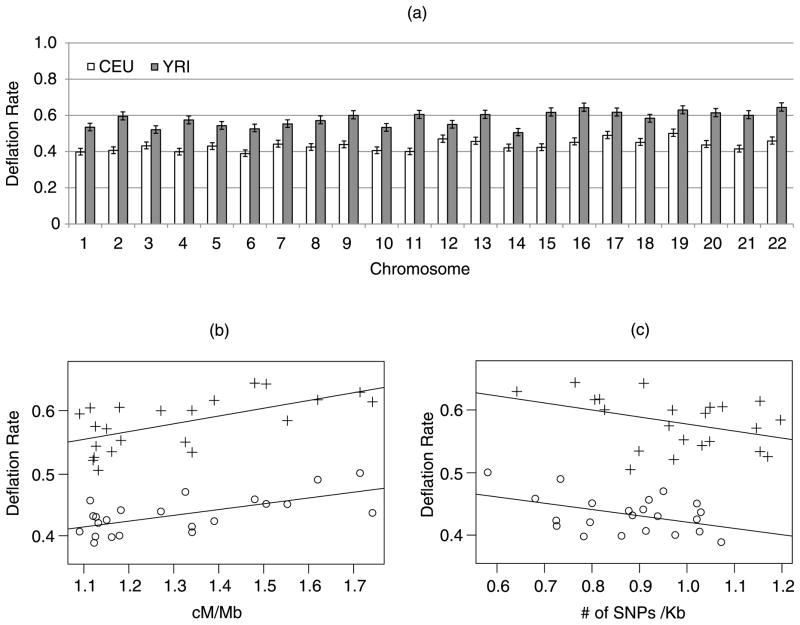
Figure 3.
Deflation rates (Di, i = 1, …, 22) estimated from HapMap Phase II SNPs on each automosomal chromosome, assuming 3 million SNPs tested genome-wide at a Bonferroni adjusted significance of 0.05. (a) Bar-plots of Di calculated from CEU and YRI individuals, respectively, with 95% confidence intervals. (b) Scatter plot of Di plotted against chromosome-wise average recombination rate (+: YRI; ○: CEU). (c) Scatter plot of Di plotted against chromosome-wise SNP density (+: YRI; ○: CEU). The correlations are −0.44 and −0.40 with corresponding p-values 0.065 and 0.038 for the two populations.

