Figure 2.
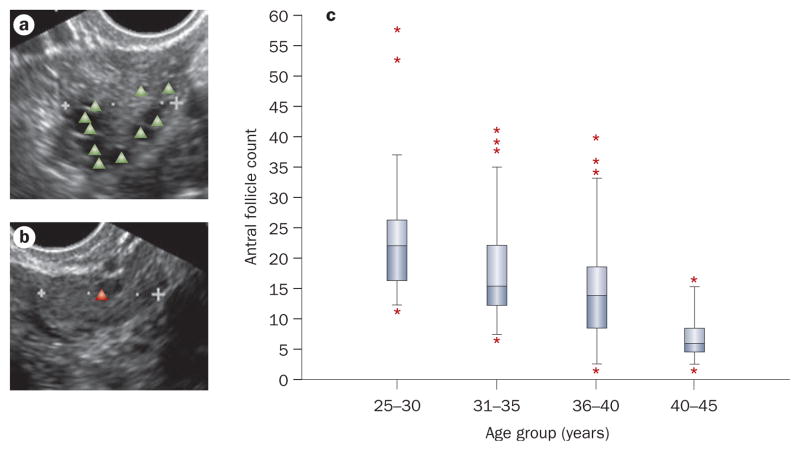
Antral follicle count. Transvaginal ultrasound images reflect a | high and b | low antral follicle counts. The triangles indicate antral follicles. c | The variability in antral follicle count in 252 healthy Caucasian women stratified by age group. Boxes represent 25th and 75th percentiles. Error bars represent standard deviation; stars represent statistical outliers.

