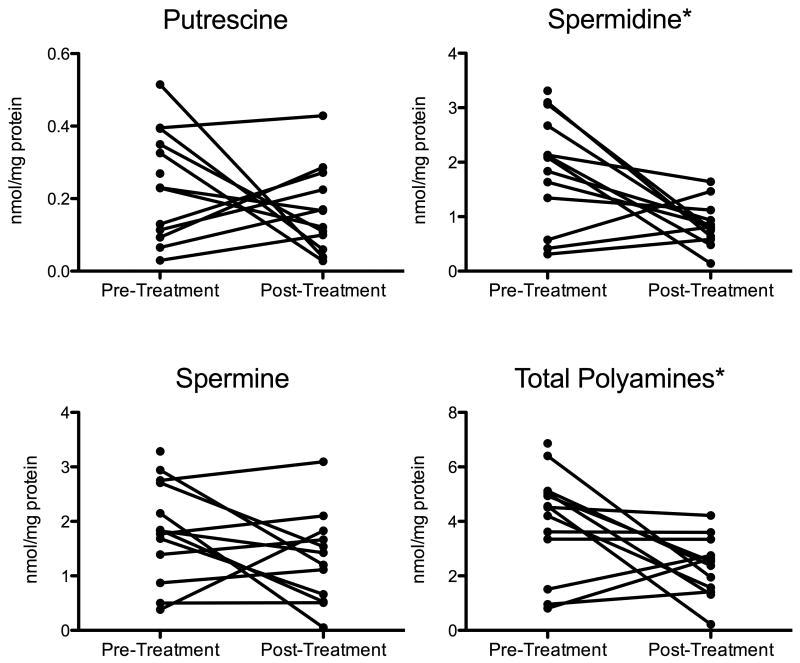
Figure 1.
Line graph plotting pre-and post-treatment tumor tissue putrescine, spermidine, spermine, and total polyamine levels in each of the 13 cats. Post-treatment measurements were not available for one cat. Statistically significant differences (noted by asterisk) between pre- and post-treatment spermidine and total polyamine tissue levels were found.

