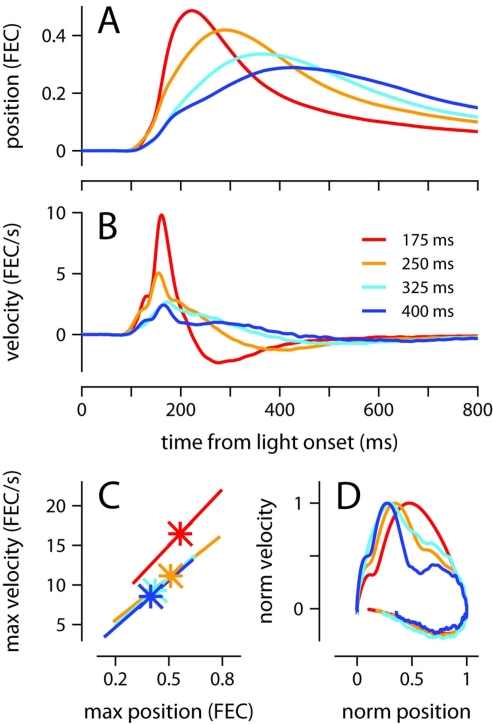
Figure 1.
Kinematic properties of the conditioned eyelid movement. (A) Average eyelid position, and (B) average eyelid velocity for mice trained with four different ISIs. (C) Asterisks indicate the average maximum position and maximum velocity for each ISI. X-range of the linear regression lines is mean of position maxima ± std across all trials for a particular ISI. (D) Normalized phase plots for the data shown in (A,B). Color code for all plots indicates trained ISI and is shown in (B). FEC, fraction eyelid closure.

