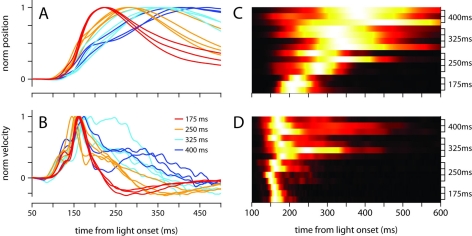
Figure 2.
Temporal profile of the conditioned eyelid movement in individual mice. (A) Normalized average position, and (B) normalized average velocity, of each mouse’s conditioned eyelid responses. Color code indicates trained ISI and is shown in (B). (C) Probability density functions for latency to maximum eyelid closure, and (D) latency to maximum velocity. Each row of the heat map contains the probability density function for an individual mouse, with trained ISI indicated on the y-axis. For display purposes, each row is normalized to have the same maximum (white).

