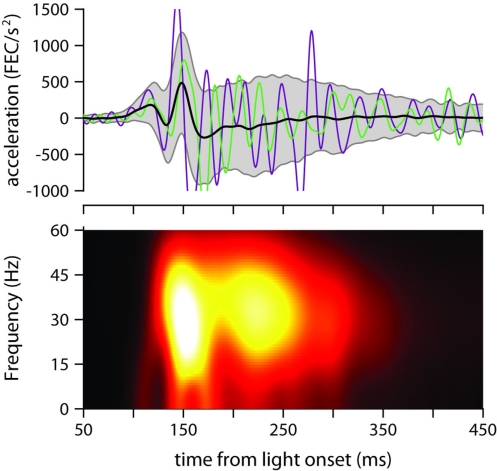
Figure 4.
Eyelid acceleration. Top: mean eyelid acceleration (black) ±1 SD (gray shaded region), and example acceleration records from two randomly selected trials (green and purple), for one of the mice trained with a 175-ms ISI (same mouse as in Figure 3A). Bottom: mean of all single-trial spectrograms of the eyelid acceleration signal for the same mouse (see Materials and Methods for details about spectrogram generation).

