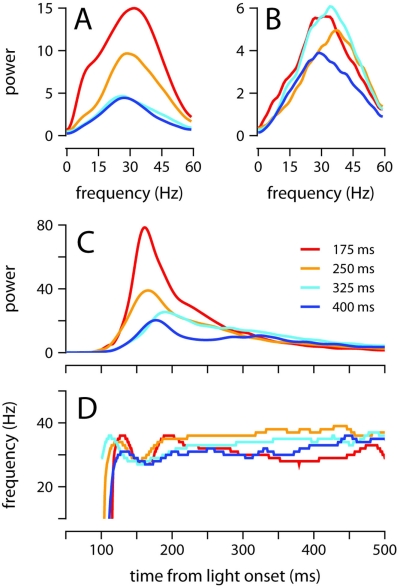
Figure 5.
Oscillatory properties of the conditioned eyelid response. (A) Average power spectrum of eyelid acceleration during the first 200 ms, and (B) from 200 to 500 ms after light onset. Spectra are plotted for each ISI separately. (C) Maximum power, and (D) dominant frequency of oscillation, in the eyelid acceleration signal. The value plotted at each moment in time in (C,D) is computed over a ~50 ms spectrogram window centered at that moment (see Materials and Methods). Each ISI plotted separately. For all plots, power is in units of (fraction eyelid closure/s2)2 Hz−1 × 10⁴, and color code indicates trained ISI as shown in (C).

