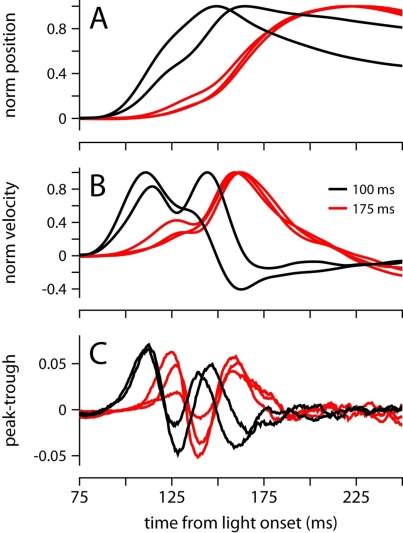
Figure 6.
Conditioned eyelid movements with a 100-ms ISI. (A) Normalized average eyelid position, and (B) normalized average velocity for mice trained with a 100-ms (black) or 175 ms ISI (red). (C) Difference between the probability of finding a peak and a trough at each ms from light onset. Color code for all plots indicates ISI and is shown in (B).

