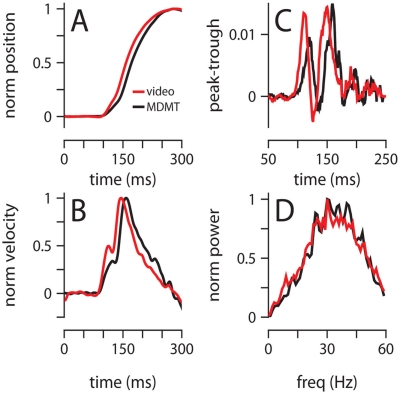
Figure 8.
Comparison of video and MDMT. (A) Normalized average position, and (B) normalized average velocity. (C) Difference between the probability of finding a peak and a trough at each millisecond from light onset. (D) Normalized average power spectrum of eyelid acceleration. Color code for all plots indicates the type of recording system and is shown in (A). All data is from two 300-trial sessions with a mouse trained with a 250-ms ISI.

