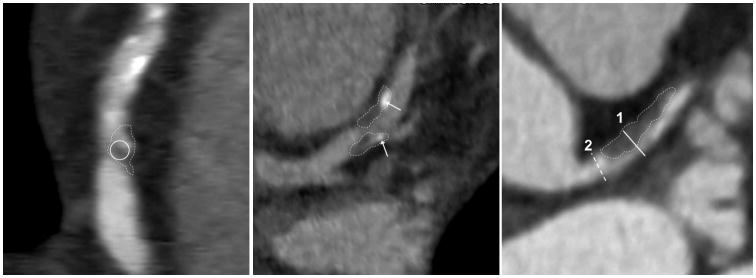
Figure 1.
Vulnerable plaque features evaluated in the study. The thin dotted lines trace out the plaques of interest in each panel. The non-calcified plaque in the left panel shows intra-plaque low-attenuation with <30 Hounsfield Units (inside the solid white circle), confirming presence of low-attenuation plaque (LAP). The middle panel shows spotty calcification (SC). The arrows denote high-intensity intra-plaque structures that occupy <90° of vessel circumference in short axis and measure <3mm in greatest dimension. Positive remodeling (PR) is shown in the right panel. Maximal outer vessel diameter along the non-calcified plaque (1, solid white line) exceeds proximal reference (2, dashed white line) by >5%.

