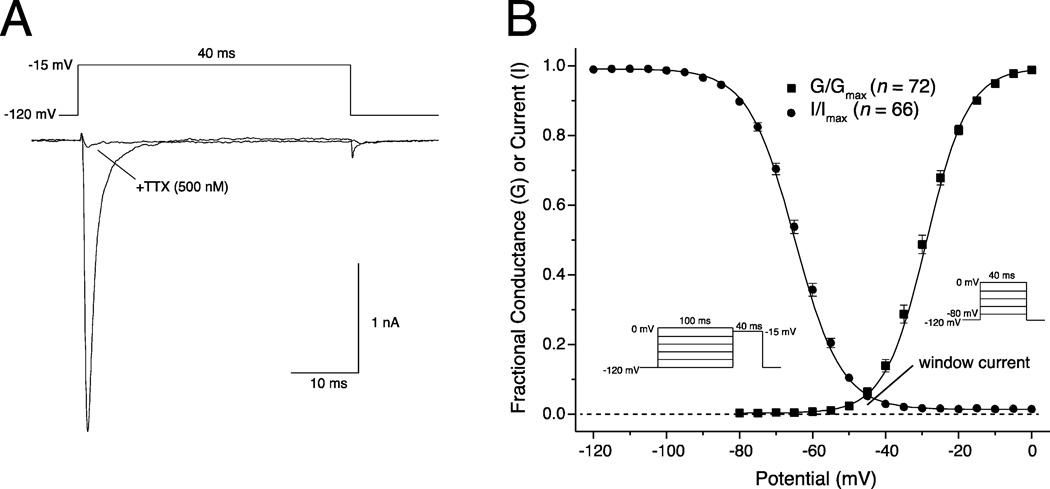
Fig. 1.
Properties of sodium currents expressed in HEK-Nav1.6 cells. (A) Representative current trace recorded during a 40-ms step depolarization from −120 mV to −15 mV before and after application of TTX (500 nM) in the perfusion medium. (B) Voltage dependence of activation and steady-state inactivation. For activation, normalized conductance (G/Gmax) was derived from the current-voltage relationship obtained using the indicated pulse protocol by dividing peak transient current (INa) by the driving force (V – Vrev) and normalizing to the maximum conductance observed in each cell. For inactivation, peak transient currents were measured using the indicated pulse protocol and normalized to the maximal peak transient current in each experiment (I/Imax). Values for G/Gmax and I/Imax were plotted as a function of test (activation) or prepulse (inactivation) potential and curves were drawn by fitting mean values to the Boltzmann equation. Values are the means of the indicated number of determinations with different cells; bars show SE values larger than the data point symbols. The dashed line indicates zero conductance or current.

