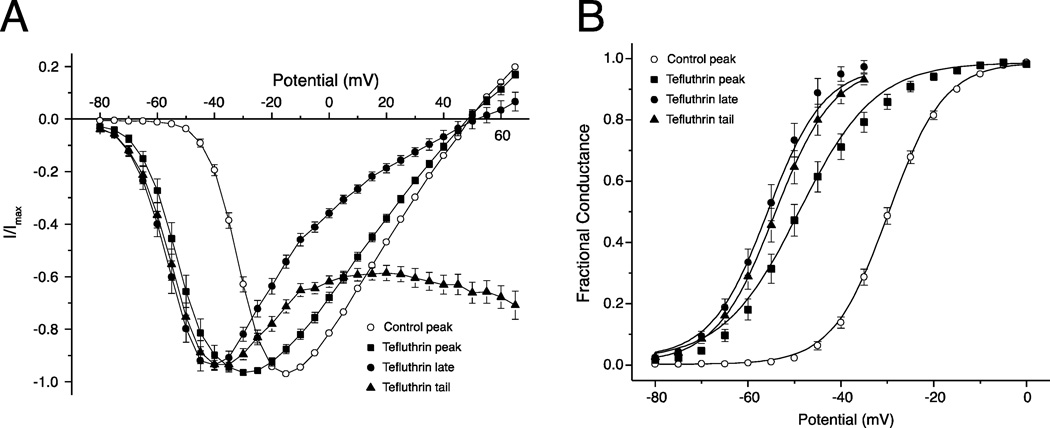
Fig. 4.
Comparison of the voltage dependence of the peak, late and tail currents induced by 100 µM tefluthrin. (A) Normalized current – voltage plots for control peak sodium currents and for the peak currents (as in Fig. 3A), late currents (measured at the end of a 40-ms depolarizing pulse) and tail currents (measured immediately following repolarization) following exposure to tefluthrin. Values are the means of 72 (control) or 14 (+tefluthrin) determinations with different cells; bars show SE values larger than the data point symbols. (B) Plots of the conductance transformations of data in Fig. 4A; curves were drawn by fitting mean values to the Boltzmann equation.

