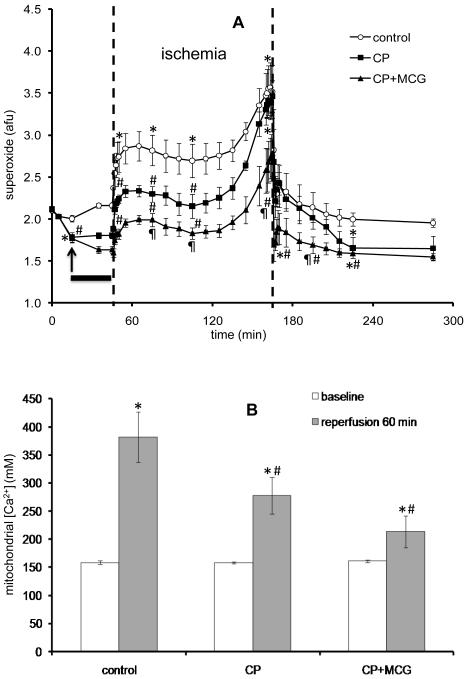
Figure 3.
(A). Time course of changes in superoxide (O2•−) signal at baseline, during treatment, hypothermia, cold ischemia, and warm reperfusion in control (n=4), CP (n=4), and CP+MCG (n=4) groups. The arrow indicates where the data point was recorded during treatment at 37°C. The solid horizontal bar indicates the period of treatment at 27°C. The period between the two unbroken vertical lines refers to ischemia. Figure 3(B). Mitochondrial Ca2+ levels in control (n=6), CP (n=7), and CP+MCG (n=5) groups at baseline and 60 min of reperfusion. *P < 0.05 values vs. baseline within each group; #P < 0.05 each treatment vs. the control group; ¶P < 0.05, CP+MCG vs. CP alone.

