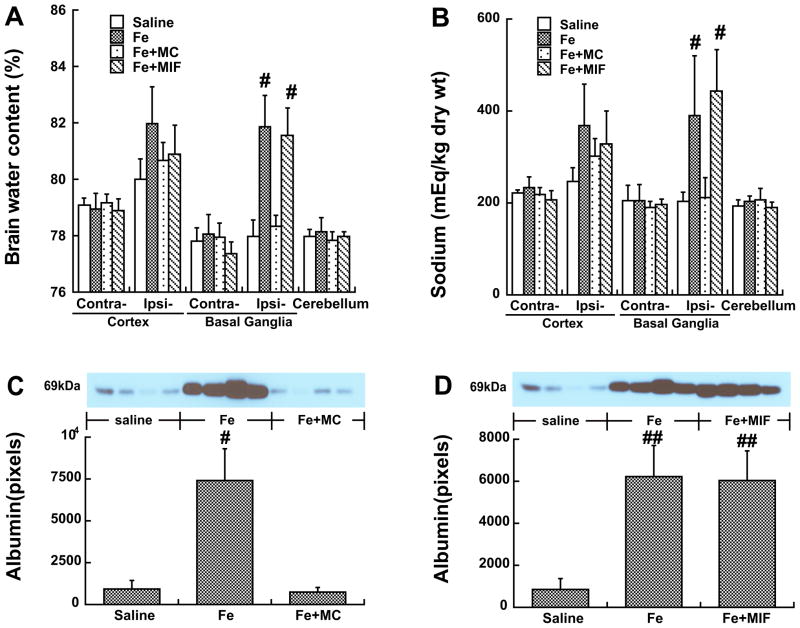
Figure 5.
Brain water (A) and sodium (B) contents 24 hours after the injection of saline, FeCl2, FeCl2+MC or FeCl2+MIF into the right basal ganglia. Values are mean ± SD; n=6, #p<0.01 vs. saline or Fe+MC group. Protein levels of albumin (C, D) in the ipsilateral basal ganglia 24 hours after the injection. Values are means ± SD; n=4, #p<0.01vs. other groups, ##p<0.01 vs. saline.

