
Figure 1.
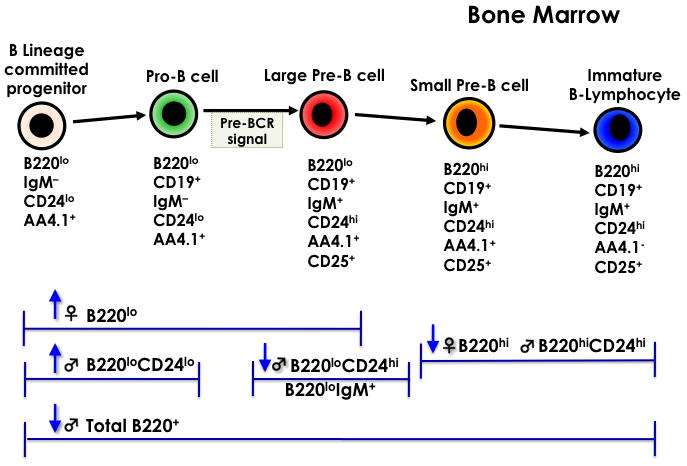
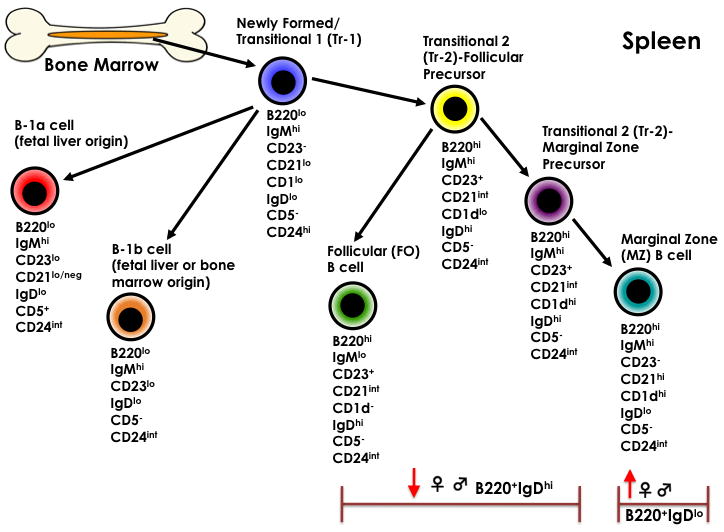
A. Bone Marrow B-cell Lymphopoiesis. B. B cell maturation in the spleen. The cell-surface markers below each cell type were evaluated. Arrows pointed up indicate a significant increase and arrows pointed down indicate a significant decrease from controls (n=5 mice/treatment/sex, p ≤ 0.05, Dunnett's test).