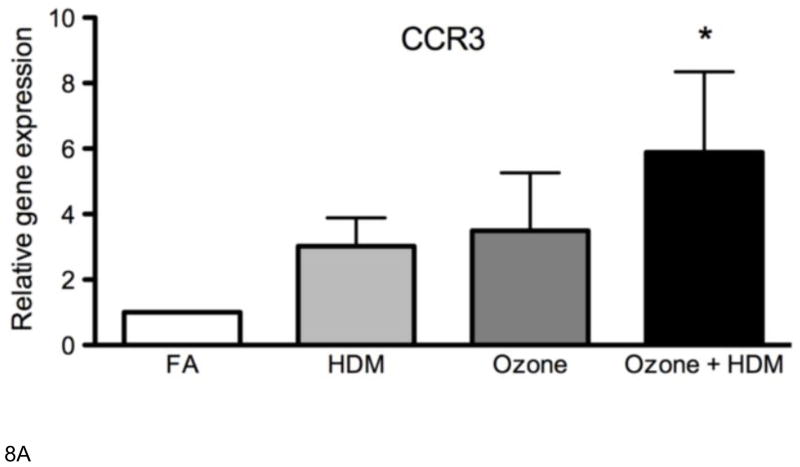
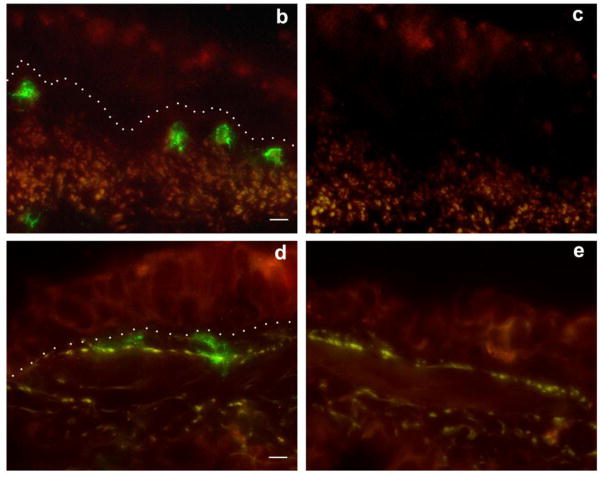
Figure 8. Effect of ozone and allergen exposure on CCR3 mRNA and protein expression in infant monkey airways.
(A) CCR3 mRNA expression was determined by real-time RT-PCR analysis of microdissected conducting airways isolated from the right caudal lobe of each animal at 3 months of age. Each column represents the change in gene expression for CCR3 relative to filtered air control infant monkeys. Columns represent the mean ± SE for 6 animals, each group treated with filtered air (FA), house dust mite (HDM), ozone, or ozone + HDM as described in Materials and Methods. (B–E) Immunofluorescence staining for CCR3 was conducted on adjacent cryosections as described for Figure 6. One representative infant monkey from HDM (b–c) and ozone + HDM (d–e) exposure group is shown. Mouse IgG1 clone MOPC 21 was used as a negative control (c, e). The dotted line represents the basement membrane zone in panels b and d. (scale bar= 10 μm).


