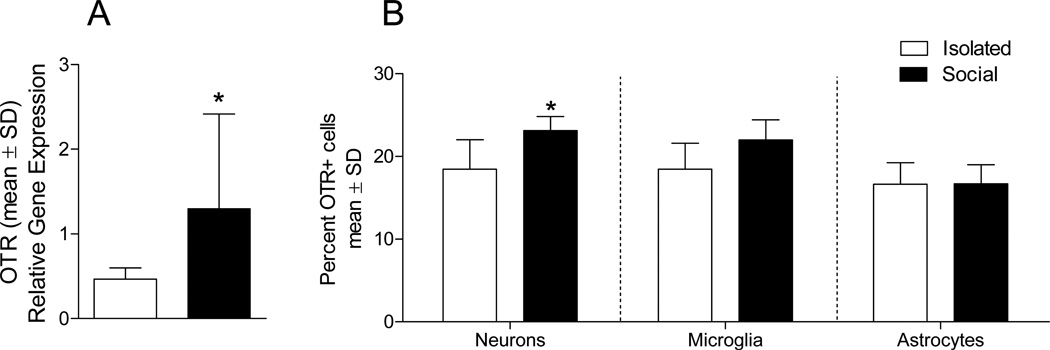
Figure 5. Oxytocin receptor mRNA and gene expression.
(A) Expression of OTR mRNA in enriched neurons is increased in socially housed (n = 12) relative to isolated (n = 9) mice. (B) Percent OTR expression in socially housed and isolated mice is shown on neuronal (NeuNpositive), astroglial (GFAP-positive) and microglial (CD11b-positive) cell populations assessed using flow cytometry, n = 5–6 per group. * indicates a statistically significant social condition difference, (P > 0.05).

