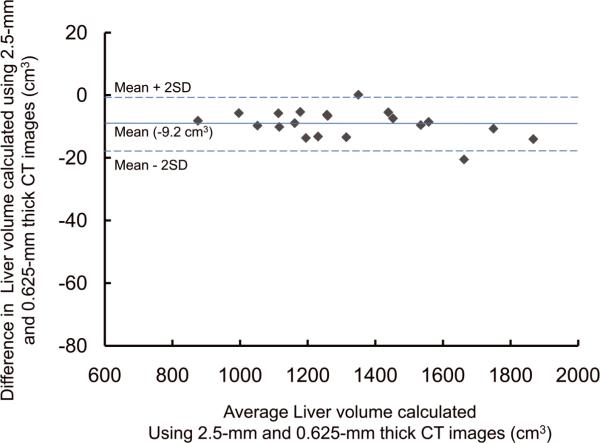
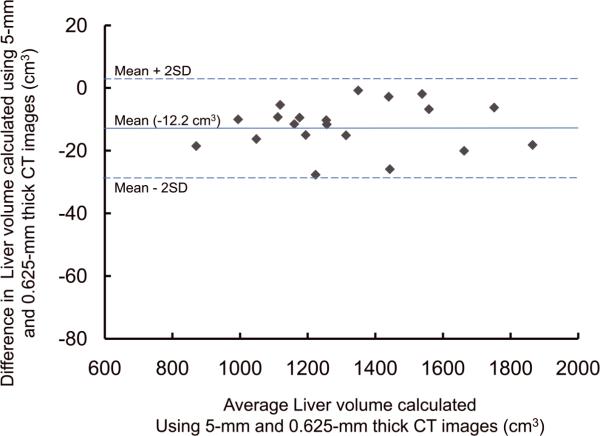
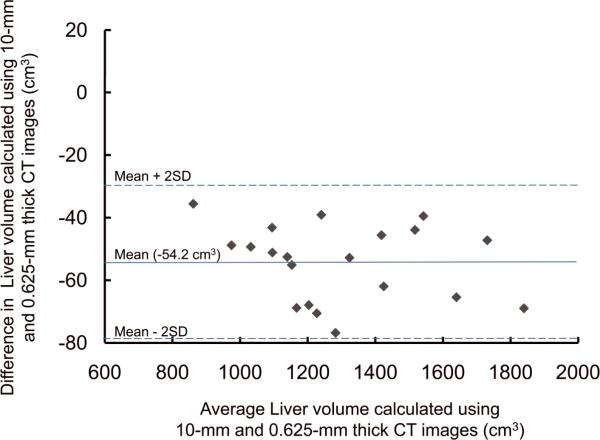
Fig. 4.
Plots of estimated whole liver volume differences between 0.625-mm and (A) 2.5-mm, (B) 5-mm, and (C) 10-mm images against their averages. There are no discrepancies in relation to the size of the liver volume measurement. A thinner slice thickness shows a smaller degree of dispersion around the horizontal axis.


