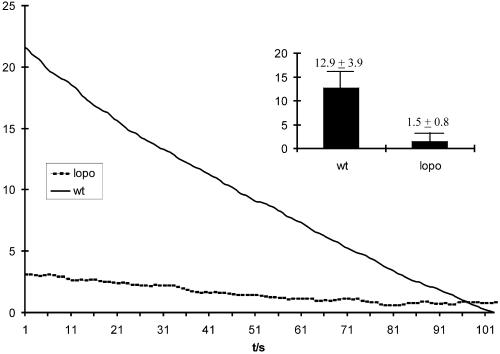
Figure 7.
Oxygen consumption in larval tissues. The graph shows a typical curve of oxygen consumption in wild type (wt; straight line) and lopo1 (dotted line). The oxygen consumption is given in nanomoles per microgram of protein; the x axis defines time in seconds (t/s). Typically the oxygen consumption in lopo1 is reduced to ∼10% of the wild-type level. The inset shows a comparison of the mean relative oxygen consumption per min (three measurements each).

