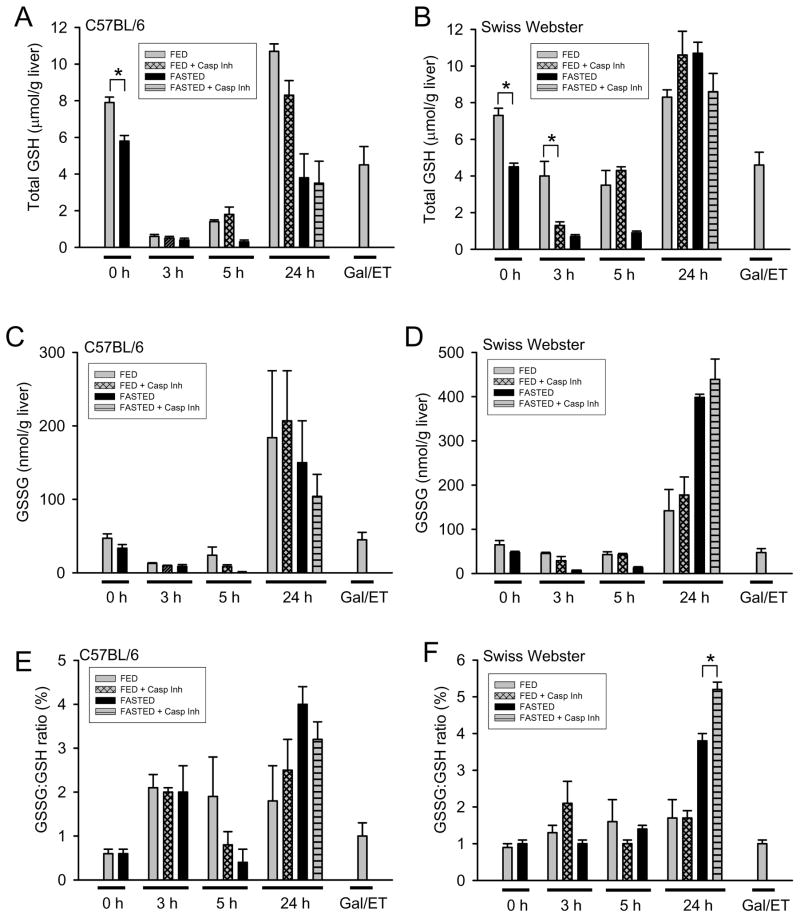
Figure 5. Total hepatic glutathione (GSH) and glutathione disulfide (GSSG).
Hepatic content of total GSH (GSH + GSSG) was quantified in C57BL/6 (A) and SW (B) mice at various times after APAP. Similarly, GSSG was measured in C57BL/6 (C) and SW (D) mice. The GSSG-to-GSH ratio was calculated from each mouse and data for the groups are presented for C57BL/6 (E) and SW (F) mice. Data represent means ± SE of n = 4–6 mice per group. *P < 0.05 (comparison as indicated by the brackets were determined by two-way ANOVA dependent on fed/fasted state and presence of caspase inhibitor)

