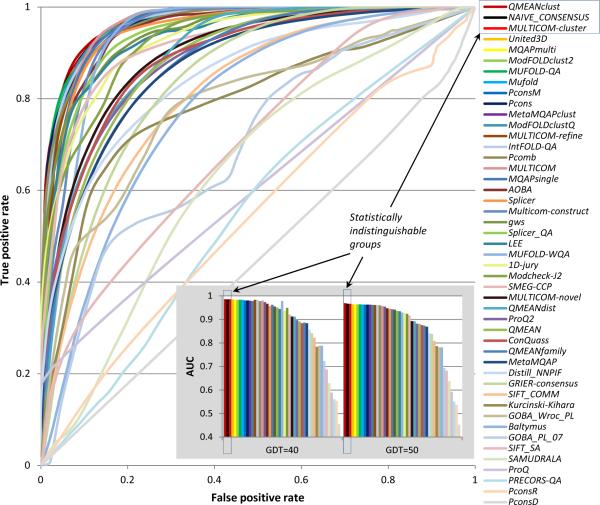
Figure 3.
ROC curves of the binary classifications of models into two classes - good (GDT_TS≥50) and bad (otherwise). Groups in the legend are ranked according to decreasing AUC scores. The inset shows the AUC scores for all the groups for two definitions of “model goodness”: GDT_TS=40 and GDT_TS=50.

