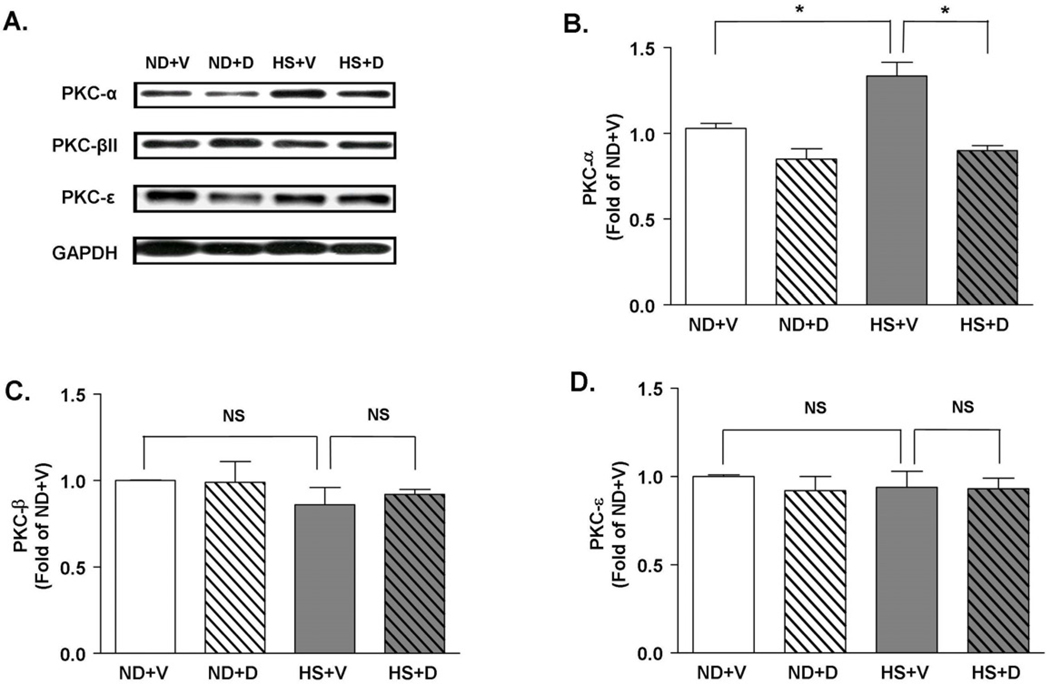
Figure 6.
Expression of PKC isoforms. (A) Representative immunoblots of PKCα, PKCβII and PKCε. GAPDH was used as an internal control. (B) HS diet caused a 1.5 fold increase in PKCα level, which was attenuated by doxercalciferol treatment. HS diet and doxercalciferol therapy did not significantly alter the expression levels of either (C) PKCβII or (D) PKCε. The intensity of each band was quantified by ImageJ software. The arbitrary values were calculated by dividing the intensity level of each PKC band by the intensity level of a corresponding GAPDH band. Measurements were represented in fold of ND+V level. ND=normal diet, HS=high salt diet, V=vehicle, D=doxercalciferol. *p<0.05, N=6–9.

