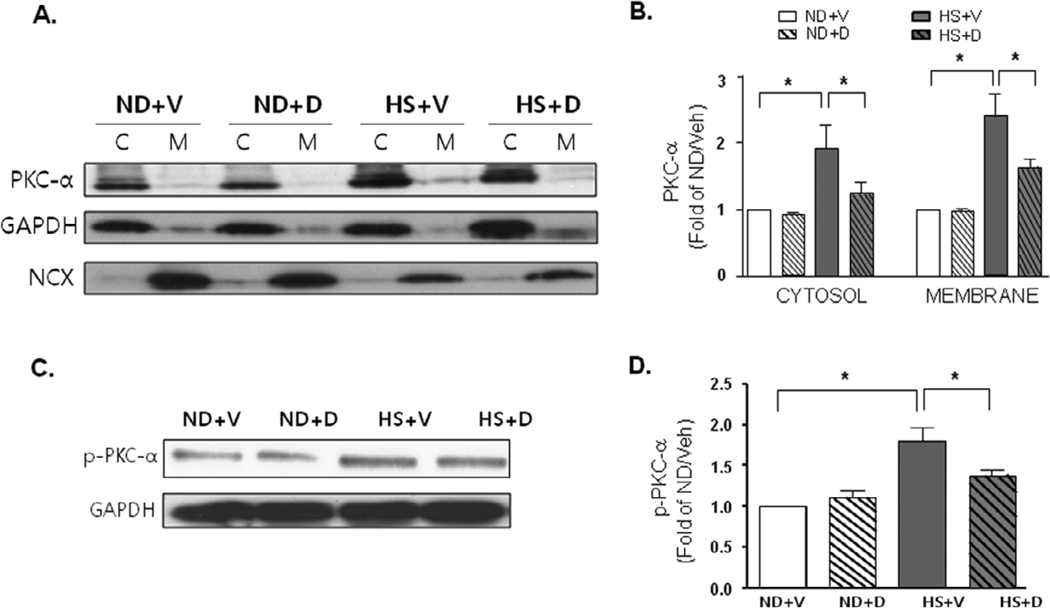
Figure 7.
Activation of PKCα. (A) Representative immunoblots of cytosolic and membrane fraction expression of PKCα. GAPDH and NCX were used as cytosolic and membrane fraction loading controls, respectively. (B) Quantitative analyses of cytosolic and membrane fraction expression of PKCα. Measurements were represented in fold of ND+V level. ND=normal diet, HS=high salt diet, V=vehicle, D=doxercalciferol. *p<0.05, N=4–6. (C) Representative immunoblots of phosphorylated PKCα expression. (B) Quantitative analyses of phosphorylated PKCα expression. Measurements were represented in fold of ND+V level. ND=normal diet, HS=high salt diet, V=vehicle, D=doxercalciferol. *p<0.05, N=4–6.

