Figure 3.
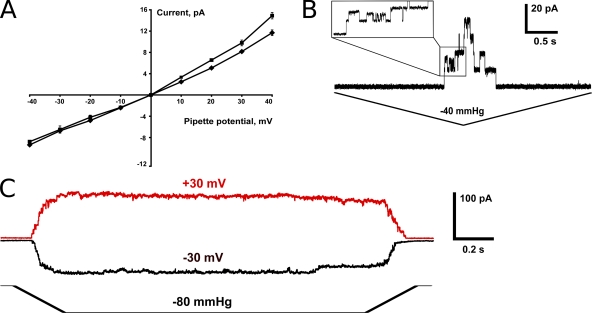
MscS exhibits low voltage dependence when expressed in oocytes. (A) The current–voltage relationship for MscS in symmetric ND96 (squares; n = 7 patches) and in TEA-Cl (diamonds; n = 4 patches). Error bars indicate standard deviation. (B) Example of conductive substates as recorded at +40-mV pipette potential. (C) Nearly symmetric activation curves recorded at opposite potentials in the same excised patch.

