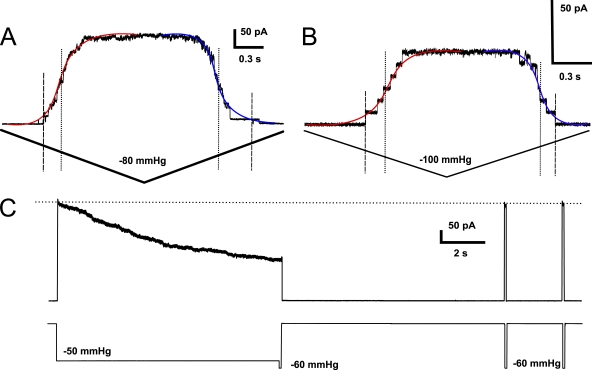
Figure 4.
Activation and inactivation behavior of MscS expressed in oocytes. (A) Representative trace from a short triangle stimulation ramp; pipette, BN 7. (B) Hysteresis of MscS is more prominent in small patches (pipette, BN 5). In A and B, slope fits for channel opening are shown in red and for channel closing in blue; dashed and dotted lines indicate threshold and midpoint tensions, respectively. Pipette potential was +40 mV. (C) Slow inactivation at subsaturating pressure with subsequent recovery during saturating tension pulses.

