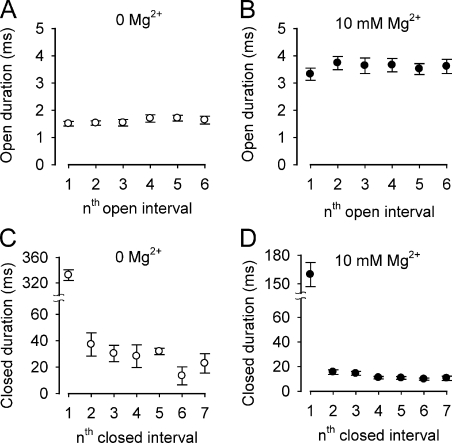
Figure 5.
Rapid equilibrium of Mg2+ action on channel gating. The first six successive mean open intervals and the first seven successive mean closed interval durations are plotted separately against successive open and closed interval numbers after a voltage step from negative holding potentials to +100 mV for 0 and 10 mM Mg2+. Data from the different prepulse holding potentials (−150, −100, and −50) were combined because there were no significant differences for the different holding potentials. The plotted points and error bars are the mean ± SEM for data at the four different prepulse holding potentials. The experimental protocol was the same as in Fig. 3, but with additional holding potentials. (A and B) Mg2+ increased the duration of the first six open intervals with no significant difference for successive interval number. (C and D) Mg2+ decreased the durations of mean closed intervals with no significant differences for successive intervals after the first. The slight trend toward briefer successive closed intervals after the first closed interval was not significant for any combination of paired intervals, but may reflect a greater likelihood for inclusion of a closed interval artificially truncated by the end of the 400-ms pulse as interval number increased. The observations in A–D suggest that Mg2+ action reaches a rapid equilibrium with the first opening. The number of single-channel patches contributing to each plotted data point ranged from 19 to 28.

