Figure 1.
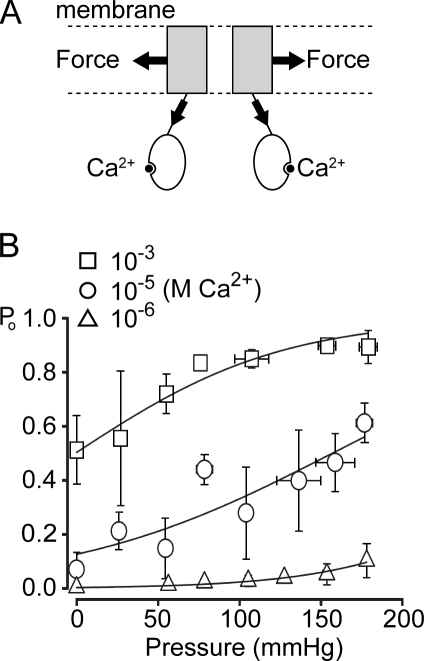
Bimodal activation of TRPY1. (A) A diagram showing that TRPY1 senses membrane stretch force through the membrane-embedded domains and Ca2+ through the cytoplasmic domains. Energetically, the open probability is governed by ΔG0 − ΔGforce − ΔGCa2+, where ΔG0 refers to the energy difference between the C and O state before the application of force or Ca2+. ΔG0 includes the energies from structures, temperature, protonation, etc. (B) The Po versus pressure plots at different [Ca2+]. For each of the three [Ca2+], Po from TRPY1 ensemble currents is plotted against the applied pressure and fitted with the following Boltzmann equation: Po = 1/[1 + a × exp(−Δα × P)], which is transformed from Po = 1/[1 + exp((ΔE − γ × ΔA)/kB × T)], where a and Δα are fitting parameters in the Po–pressure plot, with Δα (in millimeters of Hg−1) being the slope parameter; P (in millimeters of Hg) is the applied pressure; ΔE is the free energy of the channel at given [Ca2+]; g (in Newtons per meter) is the membrane tension; ΔA (in square meters) is the expansion coefficient; kB is the Boltzmann constant; and T is the absolute temperature. The transformation assumes that the radius of our patches, r (in meters), remains constant. We strictly controlled the sizes of our pipette tips in a narrow range with the bubble numbers 4.5–5.1 in ethanol(Sakmann and Neher, 1983) to approach the constancy of r. With this assumption, γ can be converted to P according to Laplace’s law. The saturation levels of channel activities were determined by applying high pressure at high [Ca2+] (10−3 M). See Materials and methods for details. Although [Ca2+] laterally shifts Po–pressure curves, all three fits have a similar Δα value (Table I), indicating that Δα defines the mechanosensitivity and is independent of [Ca2+]. Means ± SD (not SEM; n = 4 for 10−3 M, n = 6 for 10−5 M, and n = 4 for 10−6 M Ca2+).

