Figure 2.
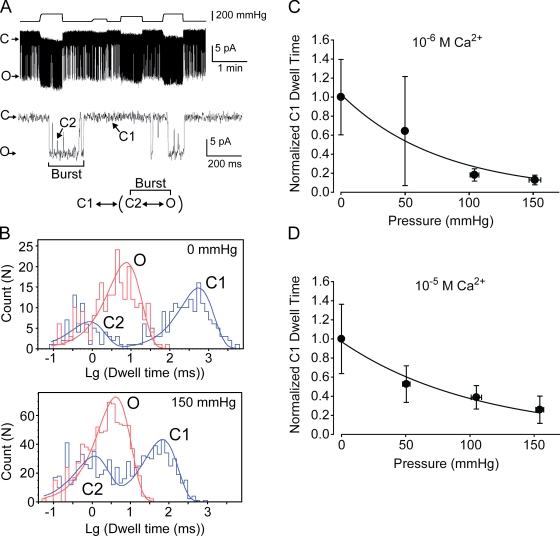
Single-channel analysis of the force activation indicating the C1 to burst transition step is mechanosensitive. (A, top) A single-channel recording at 10−6 M Ca2+ in response to different pressures over 5.5 min. (middle) An expanded view of a short portion in the top trace showing different states: an interburst closed state (C1), a burst state comprising an open state (O), and an intraburst closed state (C2). The recording presented here has higher basal Po than average, which facilitated kinetics analysis. (bottom) A minimal kinetics model for TRPY1. (B) All-point histogram of A for dwell time analyses of different states without pressure (0 mmHg; top) and with 150 mmHg of pressure (bottom). The comparison shows that pressure mainly shortens C1 without much affecting O and C2. Also see Table II. (C) The normalized C1 dwell time to that of 0 mmHg of pressure is plotted against pressure at 10−6 M Ca2+ and fitted with an exponential equation: normalized C1 dwell time = b × exp(−Δαk × P), similar to that described in Fig. 1 B. The slope parameter Δαk (Table III) here corresponds to the slope parameter Δα from the ensemble current analysis in Figs. 1 B and 3 F. (D) A plot similar to C at 10−5 M Ca2+. Means ± SD (not SEM; n = 5 for 10−6 M and n = 3 for 10−5 M Ca2+).

