Figure 3.
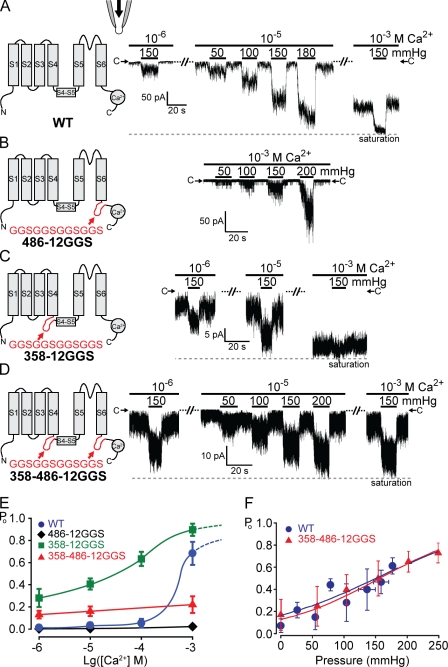
Inserting unstructured peptides before or after the S5–S6 core domain does not affect force activation. TRPY1 activities were examined in excised cytoplasmic-side-out patches bathed in the symmetric solution held at −50-mV driving inward currents. 10–20-s pressure pulses were delivered into the pipette to exert membrane stretch. (A, left) A diagram of one wild-type (WT) subunit showing S1 through S6, the S4–S5 linker, and a C-terminal Ca2+-binding domain. (right) Typical traces of the wild-type–channel activities from one patch, bathed in low (10−6 M), intermediate (10−5 M), or high [Ca2+] (10−3 M). At each [Ca2+], different amounts of positive pressures were applied as depicted with black bars. Magnitudes of the pressure pulses in millimeters of Hg are labeled. C→ marks the closed current level; the dashed line marks the current maximum. Whereas basal activities increase with [Ca2+], the increase in TRPY1 current upon pressure is clear in all [Ca2+]s and is most evident at intermediate [Ca2+] (10−5 M), where the basal activity is most suitable for the test of the force activation. (B–D) Diagrams and typical results of insertion mutants are arranged as in A. (B) 486-12GGS mutant with a 12-residue peptide (red) inserted at the C-terminal end of S6 greatly reduced Ca2+-induced basal activities. Compare basal activities at high [Ca2+] (10−3 M) between A and B. Nonetheless, pressure-induced responses are robust. (C) 358-12GGS with the 12-residue peptide inserted in front of the S4–S5 linker increased basal activities. Compare basal activities with those in A. Responses to pressure pulses are robust, though partially masked by high basal activities. (D) 358–486-12GGS with the peptide inserted at both sides of the S5–S6 core; pressure responses remain robust. Although A–D show results from typical cases, those from other patches (n = 20 for wild type and n = 6 each for 486-12GGS, 358-12GGS, and 358–486-12GGS) are highly consistent. (E) Plots of Po versus [Ca2+] showing a great reduction of the Ca2+ activation by the peptide insertion at position 486 (diamonds) and an elevation of the basal Po by the insertion at position 358 (squares). 486-12GGS did not reach clear saturation even at high [Ca2+] and under high pressure. Its Po is thus normalized to the highest level we observed and will result in an overestimation. Means ± SD (n = 3 for all). (F) Po versus pressure plots of wild type and 358–486-12GGS at 10−5 M Ca2+ fitted with the Boltzmann equation, the same as Fig. 1 B. Means ± SD (n = 6 for wild type and n = 4 for 358–486-12GGS). No clear difference in mechanosensitivity (Δα) can be discerned. See Table I. The low or high spontaneous activity of 486-12GGS or 358-12GGS, respectively, limited the accurate estimate of Po or the test range of mechanosensitivity and cannot be plotted here.

