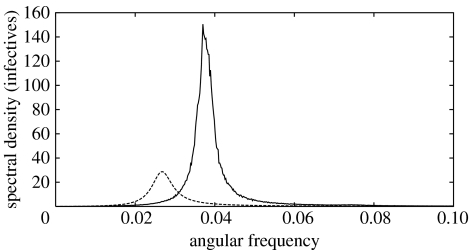
Figure 2.
Fluctuation power spectra of infective time series of stochastic SIR dynamics with deterministic and stochastic recovery on a randomly mixed population with N=106 individuals. Deterministic recovery occurs τ time steps after infection. The solid line is the averaged numerical power spectra of 400 stationary time series, each 32 768 time steps long. The dashed line is the analytic power spectra given by (2.2), with γ=1/τ. Parameter values: μ=6×10⁻⁴, β=1.32, τ=8.

