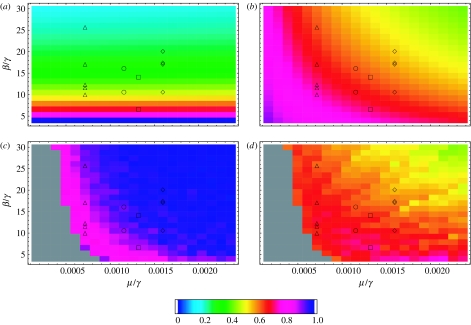
Figure 3.
Overall amplification and coherence of the randomly mixed model with stochastic recovery for 21×21 points in parameter space. The symbols mark the parameter values for measles (triangles), chicken pox (circles), rubella (squares) and pertussis (diamonds) according to different data sources for the pre-vaccination period. The analytic results for the amplification A are shown in (a), and the analytic results for the coherence c are shown in (b). The values of (a) are normalized by the largest overall amplification 0.1902. In (c,d) are plotted the numerical results for the overall amplification and coherence obtained from simulations of the stochastic process (2.1) on a population of size N=106. Shown in (c) are the values of the analytic plot (a) divided by the corresponding numerical values. Grey areas denote regions of parameter space for which less than 200 surviving runs 215 time steps long were obtained out of 500 trials.

