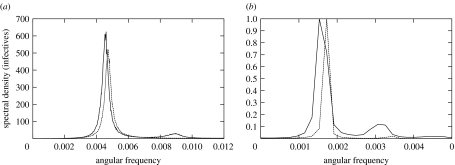
Figure 4.
Numerical power spectra obtained from stochastic simulations for N=106 and 50×106 (solid and dotted lines, respectively) for values of (μ/γ, β/γ)=(0.00094, 7.9) with p=1. The spectra were taken from 218, instead of 215, time-step long simulations for increased resolution in frequency. The curve for N=106 shows a larger overall amplification and a peak frequency shift, as well as loss of coherence due to the appearance of a small harmonic peak. (b) Power spectra of stochastic simulations on a dynamic small-world network with p=0.2 and N=106 nodes (solid line) and N=50×106 (dotted line), for the parameter values (μ/γ, β/γ)=(0.00182, 4.0) chosen in the region where the amplitude of the harmonic peaks is larger. Both plots are scaled to the largest spectral power (3960 for N=106 and 71 000 for N=50×106). The ratio of the heights of the second peak to the first peak is approximately times smaller for the larger system, in line with the expected dependence.

