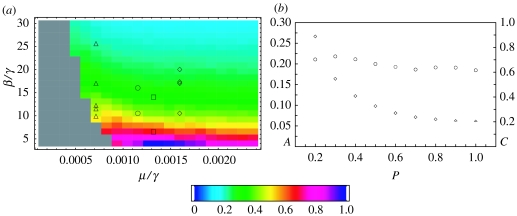
Figure 5.
Overall amplification of the SIR model with stochastic recovery on a dynamic small-world network with N=106 individuals and p=0.6 (see appendix A for details of the simulations). The values of the overall amplification A are normalized in the plot by the largest amplitude (0.2908). Again, grey areas denote regions where only a small percentage of time series survive after 215 time steps (each sampled point requires the survival of at least 200 out of 500 runs). (b) Amplification A (diamonds) and coherence c (circles) for the point (μ/γ, β/γ)=(0.00116, 17.0) as a function of the small-world parameter p. The chosen point lies approximately at the centre of the region plotted in (a).

