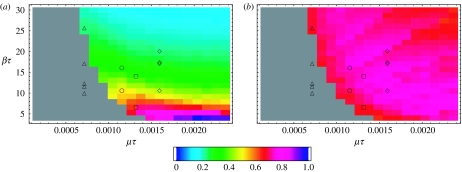
Figure 8.
Overall (a) amplification and (b) coherence for the randomly mixed SIR model with deterministic recovery over a population of N=106 individuals. The values of (a) are normalized by the largest overall amplification 0.6901. Again, grey areas denote regions of parameter space where fewer than 200 out of 500 runs survive 215 time steps.

