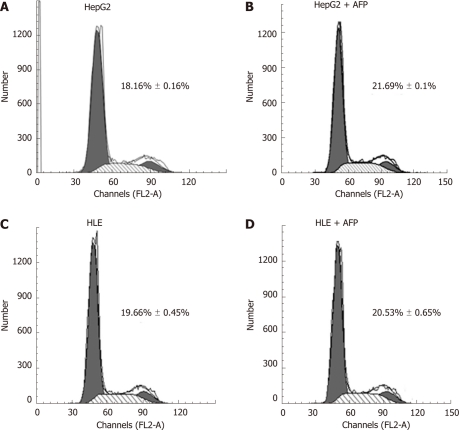
Figure 4.
Effects of alpha fetoprotein on cell cycle progression of HepG2 and HLE cells. The distribution of cells in different cell cycle phases was determined according to DNA content. The data are representative of 3 independent experiments. Each panel represents a different treatment group. A: HepG2 cells without treatment; B: HepG2 cells treated with 400 μg/L alpha fetoprotein (AFP) for 24 h; C: HLE cells without treatment; D: HLE cells treated with 400 μg/L AFP for 24 h. In each panel, the number represents cell percentage in S phase. Data are presented as mean ± SD of 3 samples. AFP: Alpha fetoprotein.

