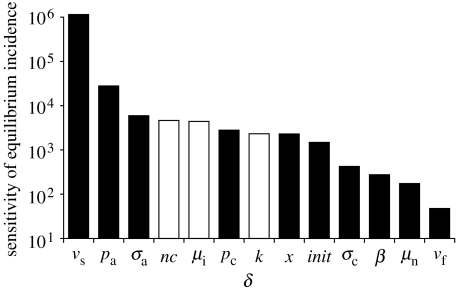
Figure 5.
Univariate sensitivity analysis of model parameters. The vertical axis shows the change in equilibrium incidence per million per year divided by 0.1% of the value of the relevant parameter, as described in §2. Black bars are increases in equilibrium incidence and white bars are decreases.

