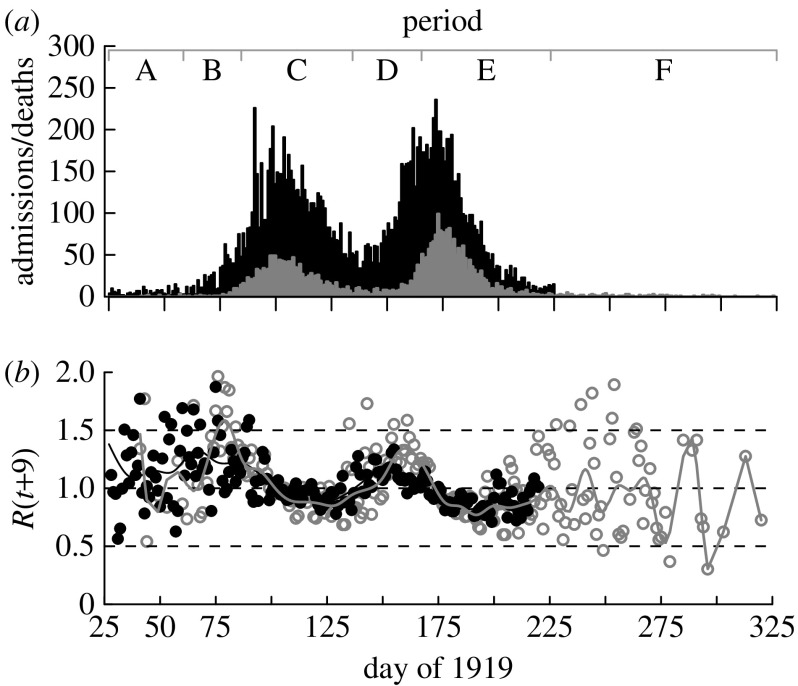
Figure 2.
(a) Epidemic curve for Sydney 1919 showing daily hospitalizations h(t) (black bars) and deaths d(t) (grey bars). Data on hospitalizations were not readily available after day 224. Periods A–F are labelled and characterized as follows: A, first cases, infection control measures; B, threat considered passed, lifting of control measures; C, reimposition of control measures, first wave; D, epidemic considered passed, lifting of control measures; E, second wave; F, epidemic passed. (b) Daily effective reproduction numbers estimated from hospitalizations (black circles and black line) and deaths (grey circles and grey line) with a smoothed cubic spline curve. Day t=25 is 25 January 1919.

