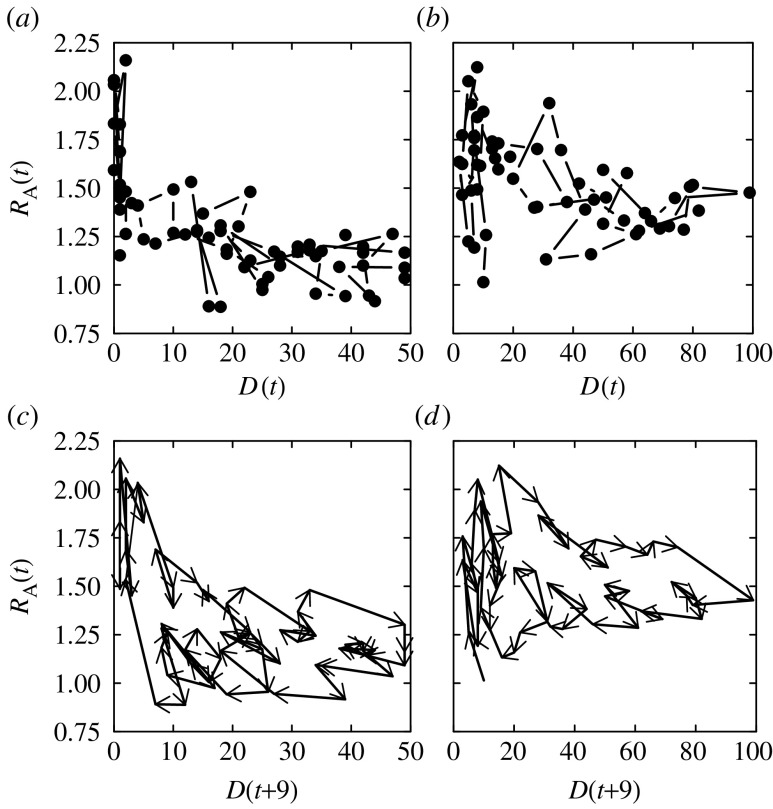
Figure 5.
The relationship between the reproduction number adjusted for susceptible depletion (RA(t)) and the daily number of deaths (D(t)) during the (a) first and (b) second waves. The trajectory of the reproduction number based on deaths adjusted for the depletion of susceptibles in relation to the daily number of deaths advanced 9 days (D(t+9)) during the (c) first and (d) second waves.

