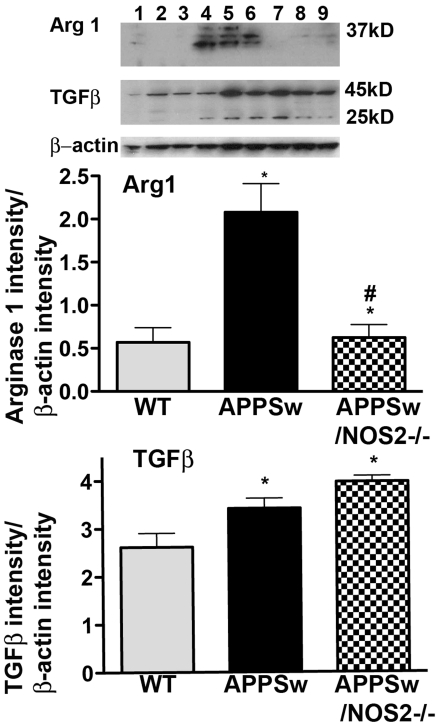
Figure 3. Western-blot analysis of AG1 and TGFβ protein levels.
Western blottings were performed using whole-brain lysates and the relative band density of each antigen compared with β-actin was calculated for AG1 and for TGFβ. All band intensities were measured using the FluorChem Q (Cell Biosciences). Lanes 1–3, WT; lanes 4–6, APPSw; lanes 7–9, APPSw/NOS2−/−; *P<0.05 compared with the WT−/− control mice; #P<0.05 compared with the parent strain.

