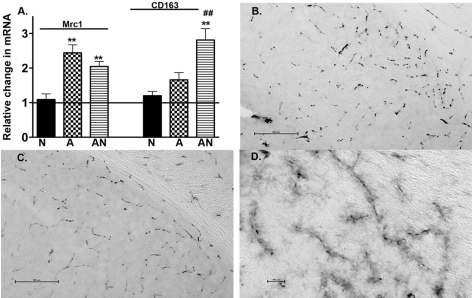
Figure 4. Changes in expression for MR and CD163.
(A) The average relative change in mRNA was determined using quantitative RT–PCR for MR (Mrc1) and the hemoglobin-haptaglobin scavenger receptor (CD163) for NOS2−/− (N), APPSw (A) and APPSw/NOS2−/− (AN) mice (n = 5–7 mice per strain). **P<0.01 compared with the NOS2−/− control. ##P<0.01 compared with the parent strain. (B–D) Immunostained sections for MR in NOS2−/− (B; magnification ×20; scale bar = 500 μm) and in APPSw/NOS2−/− mice at low (C; magnification ×20; scale bar = 500 μm) and at higher magnification (D; ×40; scale bar = 100 μm).

