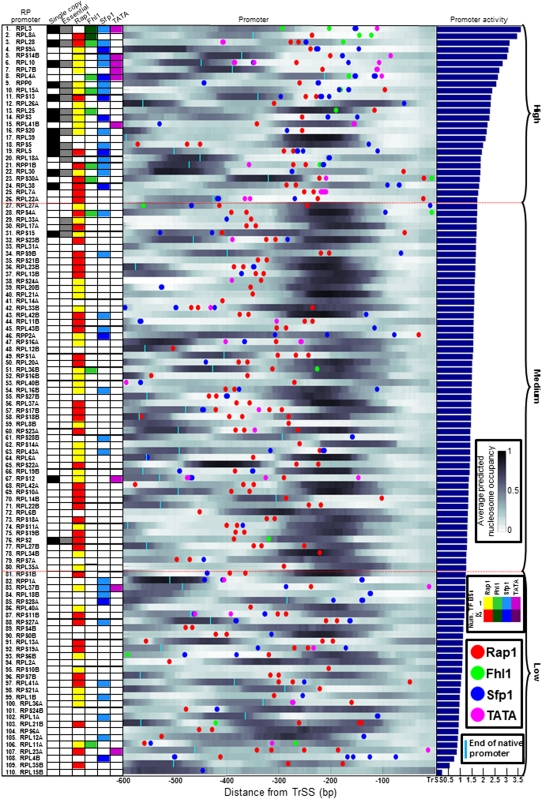
Figure 4.
Detailed view of RP promoters and their associated sequence features. RP promoters are sorted according to their measured promoter activities (right bar graph), and for every promoter, shown are the locations of TATA boxes (pink circles), and of binding sites for Rap1 (red), Fhl1 (green), and Sfp1 (blue). Sites for TATA are taken as defined in Basehoar et al. (2004). Sites for the three other factors were computed using their experimentally derived binding specificities (Badis et al. 2008; Zhu et al. 2009), and are shown above the binding site threshold determined by our computational model (see Methods, thresholds are Rap1 = 4.4, Fhl1 = 7.6, Sfp1 = 7.1). For Rap1 and Fhl1, sites are only shown in one of the two possible site orientations. In addition, shown is the per-basepair nucleosome occupancy of every promoter (occupancy is shown in a white to black scale, with white corresponding to no occupancy and black to full occupancy), predicted using a computational model of nucleosome sequence preferences (Kaplan et al. 2009). Also shown is a matrix (left) summary of the number of factor sites that appear in every RP promoter (counts for Rap1 are only shown for the 400 bp upstream of the TrSS; for Fhl1 and Sfp1, 300 bp; and for TATA, 200 bp), along with a column representing whether the corresponding RP gene exists in a single-copy in the yeast genome (first column, black), and whether it is an essential gene (second column, gray). Two horizontal dashed red lines indicate a partitioning of RP promoters into three groups of promoters with either high, intermediate, or low promoter activities. The length of each native promoter is indicated (cyan vertical line) if it is shorter than 600 bp. For locations of transcription start sites, see Supplemental Figure 18.

