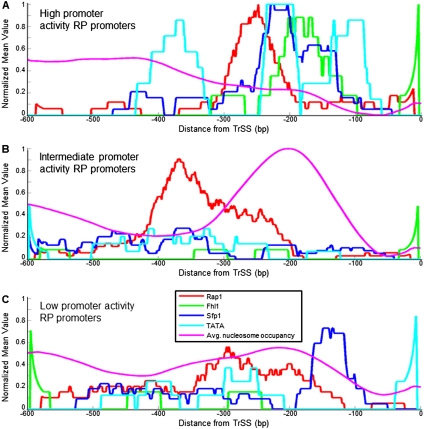
Figure 7.
RP promoters with high and low promoter activities have different promoter architectures. (A) For the group of RP promoters with high promoter activities, defined as in Figure 4, shown are the average (per promoter) number of binding sites for Fhl1 (green), Sfp1 (blue), and Rap1 (red), TATA boxes (light blue), and model-predicted nucleosome occupancy (Kaplan et al. 2009) (purple), as a function of the distance from the translation start site. Sites for Fhl1, Sfp1, and Rap1, and TATA boxes are shown using the same binding strength threshold used in Figure 4. Sites for Fhl1 and Rap1 and for TATA boxes are only counted in one of the two possible site orientations. To allow a comparison of all data types to each other, every data type was normalized to its maximum value across A–C. The plots are shown as moving averages using a window of 50 bp. (B) Same as in A, but for the group of RP promoters with intermediate promoter activities. (C) Same as in A, but for RP promoters with low promoter activities.

