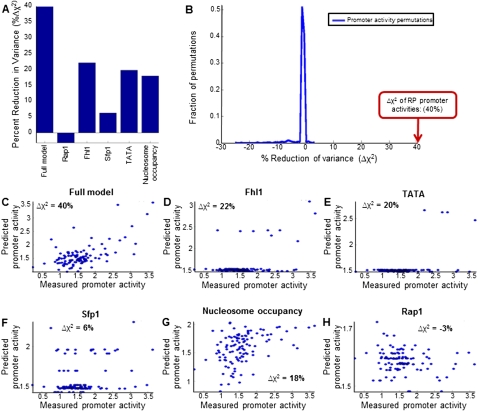
Figure 8.
A large fraction of the promoter activity variability of RP promoters can be predicted from their DNA sequence. (A) Fraction of the variance of RP promoter activities that is explained by model-predicted promoter activities, for six different models. The full model (leftmost column) combines sites for Rap1, Fhl1, and Sfp1, as well as TATA boxes and computational predictions of nucleosome occupancy (Kaplan et al. 2009). The models in columns two to six represent models that used only Rap1 sites (column two), Fhl1 sites (column three), Sfp1 sites (column four), TATA boxes (column five), or nucleosome occupancy predictions (column six). The predictions of each model were computed in a fivefold cross-validation scheme, whereby the RP promoters were randomly partitioned into five equally sized sets, and the activities of RP promoters in each set were predicted using a model whose parameters were learned using the RP promoters of the other four sets (i.e., using 80% of the data). When randomly partitioning the promoters into five sets, promoter pairs of duplicated RP genes were always assigned to the same set. (B) Histogram of the fraction of variance explained by 1000 models in which the RP promoter activities were permuted. The fraction of variance explained by the full model from A is indicated (red arrow). (C) Detailed view of the predictions of the full model from A, showing the measured (x-axis) and model-predicted (y-axis) promoter activity of every RP promoter. The fraction of the variance of RP promoter activities explained by the model is indicated in the top left corner. (D) Same as in C, for a model that only used Fhl1 binding sites. (E) Same as in C, for a model that only used TATA boxes. (F) Same as in C, for a model that only used Sfp1 binding sites. (G) Same as in C, for a model that only used predictions of intrinsic nucleosome occupancy. (H) Same as in C, for a model that only used Rap1 binding sites.

