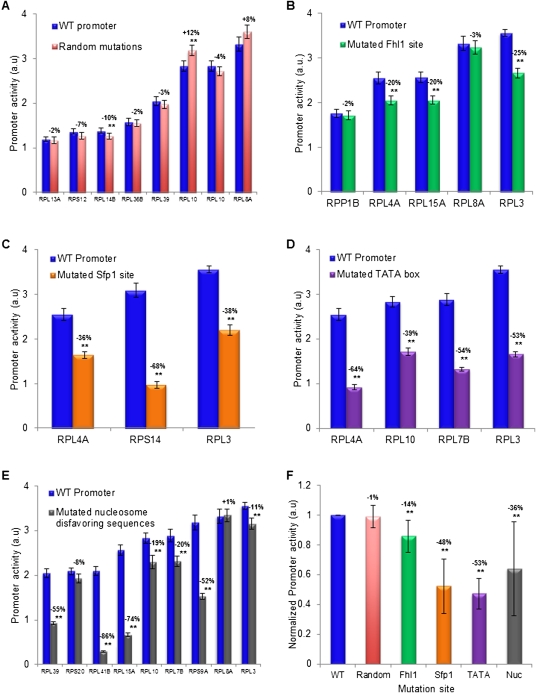
Figure 9.
Experimental validation of regulatory elements in RP promoters. (A) The effect of random mutations on RP promoter activity for eight RP promoters. For each promoter, shown is the activity of the natural promoter and a promoter in which a random mutation (1–8 bp sequence changes) was generated. Error bars represent two standard errors computed from 24 replicates. The magnitude of the effect of the mutation on promoter activity is indicated above the activity bars of each promoter pair, where two stars mark promoter activity differences that are statistically significant. (B) Same as in A, for five different mutations of Fhl1 binding sites in five different RP promoters. Mutations of Fhl1 sites were done by 2-bp changes that preserved the G/C content. (C) Same as in A, for three different mutations of Sfp1 sites in three different promoters. Mutations of Sfp1 sites were done by 2-bp changes that preserved the G/C content. (D) Same as in A, for four different mutations of TATA boxes in four different RP promoters. Mutations of TATA boxes were done by 2–3 bp changes that preserved the G/C content. (E) Same as in A, for nine different mutations of nucleosome disfavoring sequences in nine different RP promoters. Mutations to these A/T-rich nucleosome disfavoring sequences were done by replacing 16 A/T base pairs with G/C base pairs in a region of 31 base pairs within the promoter that had the lowest predicted nucleosome occupancy (Kaplan et al. 2009). (F) Summary and comparison of the effect of the mutations according to the type of element mutated. For each type of mutation from A to E, the average and standard deviation of the effect on promoter activity of all of the different mutations done to these elements are shown, where the effect is taken from the numbers above the various bars in A–E, such that the wild-type promoter (WT, leftmost bar) is defined to have a promoter activity of 1.

