Figure 4.
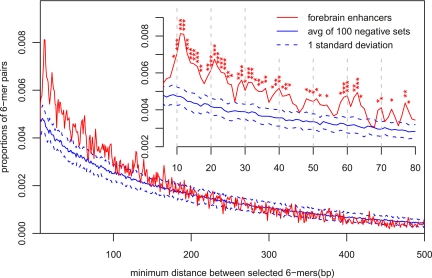
Predictive SVM sequence features are spatially clustered. Distributions of minimum pairwise distances between the most predictive sequence features in forebrain enhancers vs. random genomic sequences. Ten 6-mers with the largest positive SVM weights (Table 1) are used. To measure the significance of these differences, we generated 100 distinct full negative genomic sequence sets (using our null model; see Methods). Each negative set has the same length, repeat fraction, and number of sequences as the EP300 forebrain enhancer training set. The predictive elements are significantly clustered in the forebrain enhancers compared to the random genomic sequences (the red distribution is significantly shifted toward smaller minimum distance). At higher resolution (inset), distinct peaks around 11 bp, 22 bp, etc., are observed, suggesting positioning in phase with the periodicity of the DNA helix. P-values are indicated: (*) <0.01, (**) <0.001, (***) <0.0001.

