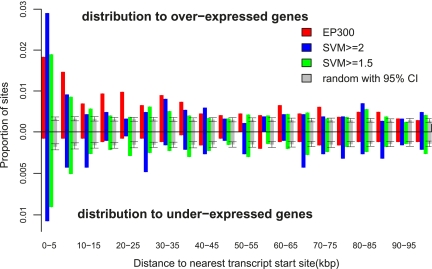
Figure 6.
SVM-predicted enhancers are preferentially located near transcript start sites (TSSs) of forebrain-expressed genes. Here we plot the distribution of the distance between the EP300 and SVM-predicted regions and the nearest forebrain-expressed gene [as assessed by the microarray experiments of Visel et al. (2009)]. Any region which overlapped a training set region was excluded from the analysis. Both the EP300 (red) and SVM-predicted regions are preferentially located within 10 kb of the TSS of a forebrain-overexpressed gene (above the axis). This is true whether we use a cut-off of SVM > 1.5 (green) or a more restrictive SVM > 2.0 (blue) to define the enhancer set. As a null set, we compare to the average of 100 randomized genomic positions, with a 95% confidence interval shown (gray). Interestingly, when we calculate the same distributions for the distance between a EP300 or SVM-predicted region and the nearest forebrain-underexpressed gene (below the axis), only the SVM-predicted regions show significant clustering toward the TSS, relative to the randomized control. Although the EP300 data preferentially identifies activating enhancers in the forebrain, the SVM may be detecting common sequence features shared in enhancers, which are repressive in the forebrain but are activating in other contexts.

