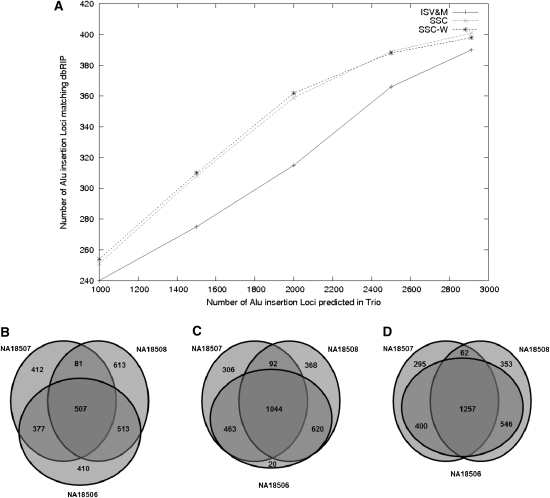
Figure 2.
Alu insertion analysis of the YRI trio genomes. (A) Comparison of the Alu predictions made by the ISV&M, SSC, and SSC-W algorithms, which match Alu insertion loci reported in dbRIP (true positive control set). The x-axis represents the number of Alu insertions (with the highest support), while the y-axis represents the number of these insertions that have a match in dbRIP. (B–D) The number of common and de novo events in each genome as predicted by the ISV&M, SSC, and SSC-W algorithms, respectively (the top 3000 predictions were considered).

