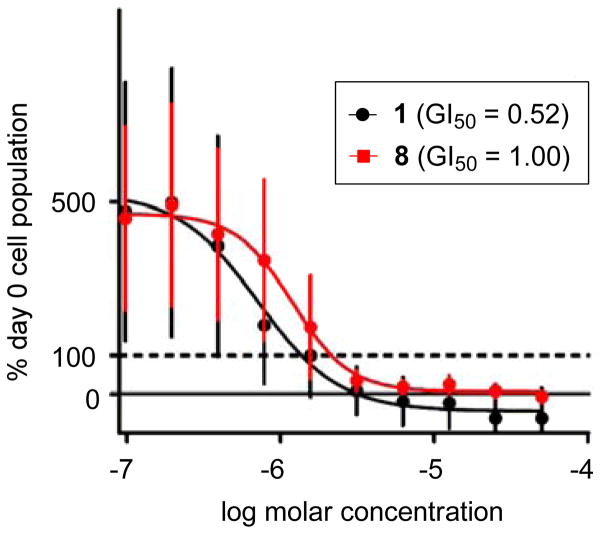
Figure 5.
Comparison of growth inhibition of HL-60 cells between parthenolide (1) and compound 8 after three days. Data for parthenolide (1) are colored in black and compound 8 are colored in red. GI50 values for 1 and 8 are not statistically significantly different. The horizontal dotted line marks 100% Day 0 cell density (i.e. the original population size of the cells when they were first seeded into the wells).

