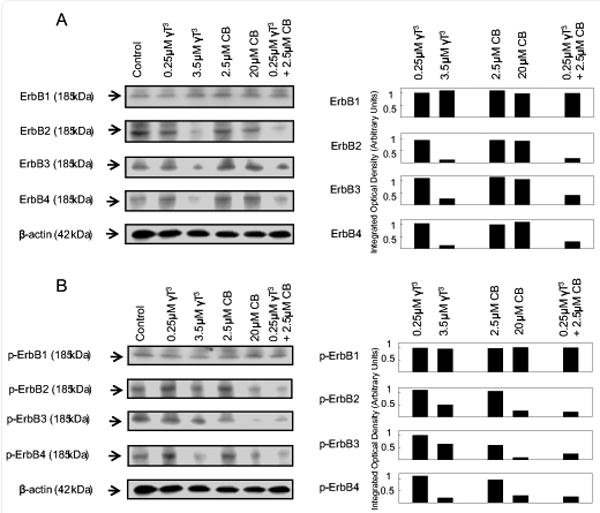
Figure 5.

Western blot analysis of γ-tocotrienol and celecoxib treatment alone and in combination on (A) ErbB1, ErbB2, ErbB3, and ErbB4, and (B) p-ErbB1 (Tyr 1173), p-ErbB2 (Tyr 877), p-ErbB3 (Tyr 1289) and p-ErbB4 (Tyr 1284) in neoplastic +SA mammary epithelial cells. Cells were initially plated at a density of 1×10⁶ cells/100 mm culture dishes, divided into different treatment groups, and then maintained on their respective control or treatment media for a 4-day treatment period. Afterwards, cells were isolated and prepared for Western blot analysis. Samples were analyzed for relative levels of the proteins. Scanning densitometric analysis was performed for each blot to visualize the relative levels of proteins. Integrated optical density of each band was normalized with their corresponding β-actin and control treatment bands and then shown in bar graphs. Vertical bars indicate the fold-change in protein levels in various treatment groups as compared with their respective controls.
